Company
Aristocrat Interactive
Role
Lead UX Designer
Timeline
[Add dates]
Team
[Add team]
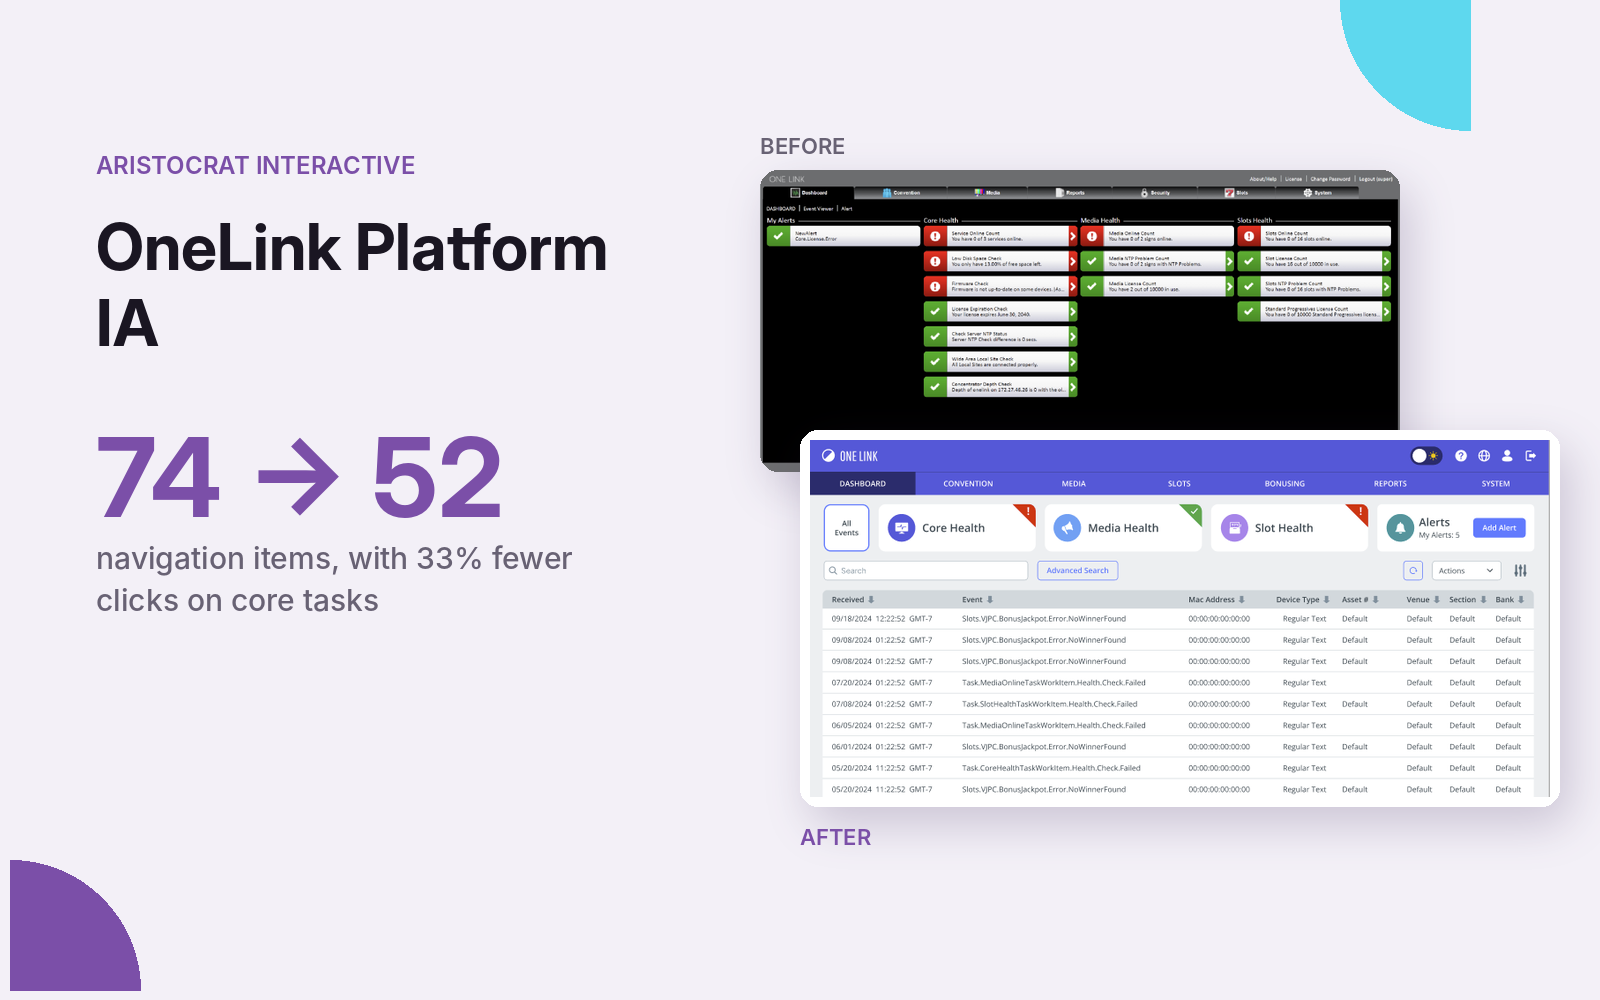
Casino operators found the platform slow, unpredictable and overly manual, with 74 secondary navigation items and no clear hierarchy.
33% fewer clicks on core tasks
- 74 → 52 secondary navigation items
- 8 → 7 primary tabs, with a new tertiary level
- 33.3% fewer clicks on core dashboard tasks
The problem
OneLink is an enterprise casino management platform. Contextual inquiry and empathy interviews during customer site visits surfaced consistent friction: slow load times, unpredictable system behavior, overly manual interactions, low learnability and distrust, and inefficiency across multi-site operations.
Discovery
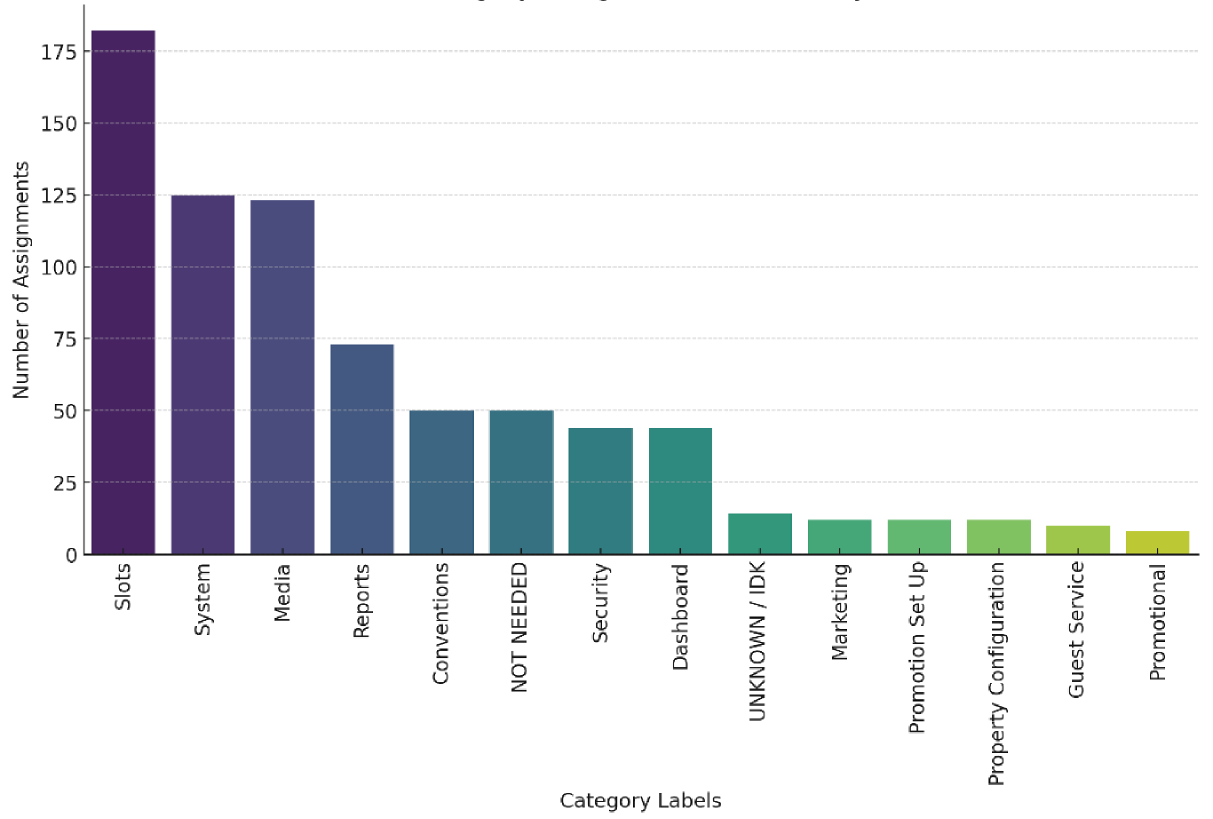
Language and taxonomy didn’t line up across products, so I ran a card sort covering OneLink and the Loyalty product. It showed which categories users understood strongly, where they were confused, and where items overlapped or repeated.
What changed
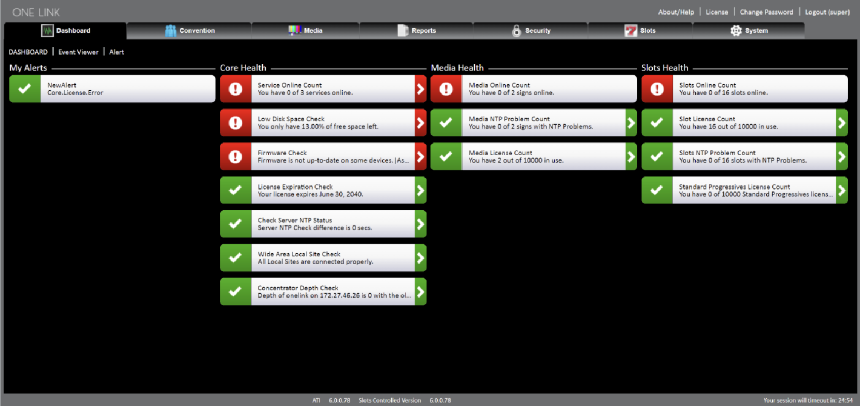
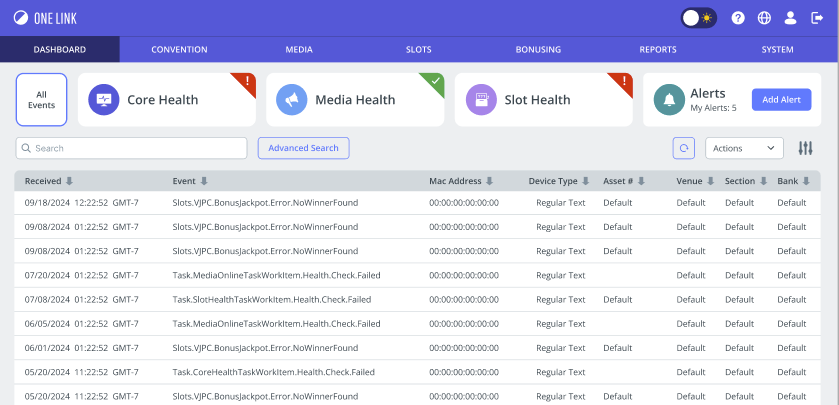
- Dashboard: three separate tabs became a single-page overview, so users can reach everything without leaving the dashboard.
- Systems & Security: two separate tabs were merged under one Systems tab, validated by the card sort.
- Permissions: scattered security items were grouped into one Permissions area that handles users and user groups.
- Consistency: visual design and interaction patterns were aligned with a sibling product, so users carry their knowledge between them.
Outcome
- Navigation restructured from 8 primary and 74 secondary items to 7 primary, 52 secondary and 13 tertiary.
- Core dashboard tasks went from 6 clicks to 4 (33.3% fewer), and users visit one fewer screen on average per task.
Next step: evaluate the redesign with users and continue restructuring the remaining modules.
Details under NDA. Happy to walk through the full project in an interview.

